Many businesses invest heavily in marketing and lead generation but still struggle to understand why growth feels inconsistent, expensive, or harder than it should be.
In many cases, revenue is not being lost at the top of the funnel. It is leaking inside the system.
These issues often remain hidden while silently reducing revenue, increasing acquisition costs, and limiting growth.
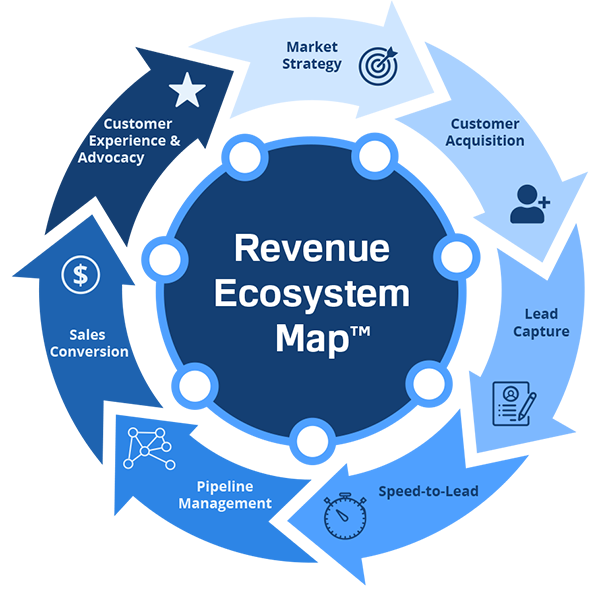
Revenue growth does not occur in a straight line. It occurs inside an interconnected ecosystem where each stage influences the next.
When one stage underperforms, downstream results suffer.
When the ecosystem is aligned, growth becomes more measurable, scalable, and efficient.
Most consulting firms focus on one area of the business—marketing, CRM, sales, or operations.
Our methodology evaluates the full revenue system using a proprietary framework stack designed to identify hidden constraints, quantify impact, and prioritize improvements.
Identifies where operational breakdowns are causing leads, opportunities, or value to be lost between stages.
Measures performance across the seven key components of the revenue system using a structured scoring model.
Translates operational inefficiencies into estimated financial impact and missed revenue opportunity.
A free diagnostic tool that helps businesses identify potential weaknesses across all seven stages.
Different constraints require different levels of intervention. Our commercial engagements are designed to meet businesses where they are.
A structured analysis of your marketing, lead capture, CRM pipeline, follow-up systems, and conversion process designed to identify where revenue may be leaking and what to fix first.
Hands-on strategic support to correct bottlenecks, broken workflows, pipeline friction, handoff failures, and execution gaps.
Ongoing advisory support for businesses focused on continuous optimization, strategic growth, and higher operational performance.
Dashboards, KPI systems, analytics, and executive visibility designed to support better decisions and stronger accountability.
Many organizations underestimate how much revenue is lost through small inefficiencies across multiple stages of the system.
Minor improvements in response time, qualification, follow-up, conversion consistency, retention, and operational alignment can materially impact overall revenue performance.
Consider a simplified example:
Current performance: 200 × 20% × $5,000 = $200,000 monthly revenue
If operational improvements increase conversion to 25%:
Optimized performance: 200 × 25% × $5,000 = $250,000 monthly revenue
| Metric | Current System | Optimized System |
| Monthly Leads | 200 | 200 |
| Close Rate | 20% | 25% |
| Avg Client Value | $5,000 | $5,000 |
| Monthly Revenue | $200,000 | $250,000 |
A modest increase in conversion performance can create substantial revenue growth without increasing lead volume.
Lead response delays were reducing booked appointments. After workflow redesign and accountability improvements, response speed and booking performance improved.
Weak pipeline structure created inconsistent forecasting and close-rate volatility. After pipeline optimization, visibility and consistency improved.
Executives lacked reliable reporting across teams. A new KPI dashboard system improved decision-making and accountability.
Take the Revenue System Self-Assessment™ to identify potential inefficiencies across all seven stages of your revenue ecosystem.
If revenue feels harder than it should be, the issue may not be effort. It may be architecture.
Let’s identify what is limiting performance and what to do next.