
Leadership teams often sense something is off. Revenue is inconsistent. Sales cycles are getting longer. Churn feels higher than it should be. Ad costs are rising.
But without numbers, every conversation becomes an opinion battle.
- “We should invest more in marketing.”
- “No, sales needs better training.”
- “It’s the leads – they’re low quality.”
- “We need better technology.”
These are not decisions. They are guesses.
Quantification ends the debate.
When you can answer questions like:
- How much is slow response costing you each month?
- What would a 5% close-rate improvement yield in annual revenue?
- What’s the real cost of churn – not just lost customers, but replacement acquisition spend?
Once you have those numbers, priorities become obvious. You stop guessing and start focusing.
The High Cost of Unmeasured Decisions
Let’s compare two approaches.
Approach A – Guess and spend (typical)
- Leadership feels marketing is weak → increase ad budget by $20k/month.
- No measurement of response time or conversion.
- Leads increase slightly, but revenue doesn’t move.
- After 3 months, $60k spent, no growth.
Approach B – Measure and target
- Self-Assessment shows Speed-to-Lead score = 2/10.
- You estimate current response time = 4 hours.
- You calculate that cutting to 5 minutes could increase contact rate from 20% to 40%.
- With 200 leads/month, that’s an additional $600k/year.
- You spend $5k on routing and alerts.
- Result: response time drops, contact rate doubles, revenue grows.
Difference: Approach A wasted $60k. Approach B invested $5k and gained $600k
The most expensive money you spend is the money you spend on the wrong stage. Measurement is cheap. Guessing is expensive.
The Metrics That Drive Prioritization
You don’t need a dashboard of 100 numbers. You need a handful of decision-ready metrics.
Use this table as your starting point.
Stage | Metric | What It Tells You |
Market Strategy | Lead quality score (1-5) | Are you attracting the right prospects? |
Customer Acquisition | CAC, source mix | Which channels are efficient? |
Lead Capture | Form conversion %, missed call % | How much demand are you losing? |
Speed-to-Lead | Avg response time, % contacted within 5 min | How fast do you engage? |
Pipeline Management | % deals with next step, stale deal % | Is your forecast reliable? |
Sales Conversion | Close rate by rep, sales cycle length | Where do deals die? |
CX & Advocacy | Monthly churn %, NPS, referral rate | Are you retaining and growing customers? |
Pick 1-2 per stage. Measure them weekly or monthly. Review them as a leadership team.
How to Quantify Quickly (Without a Data Science Team)
Method 1 – Use the Revenue Leakage Estimator™
Our free tool calculates the financial impact of:
- Missed leads
- Slow response
- Weak conversion
- Churn
No email required. Two minutes. You get an annual estimate for each leak.
Method 2 – Run simple point estimates
Pick one stage. Estimate current performance vs. achievable target. Multiply by volume.
Example: Speed-to-Lead
- 200 leads/month
- 20% contact rate at 4 hours → 40 contacts
- 40% contact rate at 5 minutes → 80 contacts
- Additional 40 contacts × 25% close rate × $5,000 = $50,000/month = $600,000/year
That’s directional. That’s enough to prioritize.
Method 3 – Take the Self-Assessment
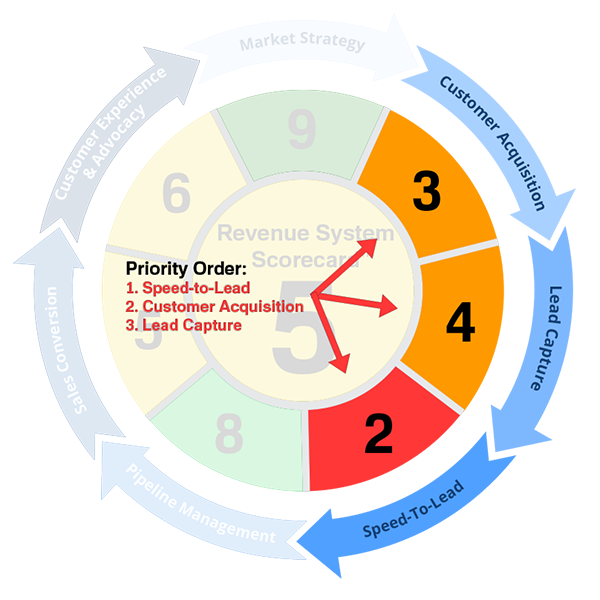
The Revenue System Self-Assessment™ gives you a 1-10 score for each stage. The lower the score, the bigger the likely leak. Use the score to decide where to measure more deeply.
From Measurement to Prioritization
Once you have numbers, use a simple matrix.
Impact | Urgency | Action |
High | High | Fix now |
High | Low | Schedule soon |
Low | High | Reevaluate (is urgency real?) |
Low | Low | Monitor, don’t act |
Example:
- Speed-to-Lead: estimated $600k impact, easy to fix → High/High → fix now.
- Market Strategy: estimated $50k impact, needs 3 months → High/Low → schedule next quarter.
- Lead Capture: estimated $30k impact, moderate effort → Low/High → re-evaluate.
Now you have a roadmap. Not guesses.
What to Do After Prioritization
If the biggest leak is in your control (e.g., Speed-to-Lead), fix it yourself using the steps in our other posts.
If the root cause is unclear – e.g., close rate is low but you don’t know why – book a Revenue Pipeline Diagnostic™. We’ll find the specific breakdowns and deliver a prioritized roadmap.
You can’t improve what you can’t quantify. And you can’t prioritize what you haven’t measured.
Stop guessing. Use the Estimator, then the Self-Assessment. Get numbers. Then act.
Measurement is the first step to real growth.