
Most leadership teams work hard. They hold meetings. They launch initiatives. They review dashboards.
But without numbers, priorities become opinions.
- “We should probably focus on marketing.”
- “No, sales needs better training.”
- “It’s the leads – they’re low quality.”
These are not decisions. They are assumptions.
Quantification changes the conversation. When you know that a 5% increase in close rate is worth $200k, or that cutting response time from 4 hours to 5 minutes could add $150k, you stop guessing.
You start managing.
The Sequence That Works
The right order is not: “Guess → Act → Hope.”
It is:
System → Measurement → Constraint → Improvement
Step 1: Understand the system
You need a model of how revenue is created, stage by stage. That’s the Revenue Ecosystem Map™ (7 stages).
Step 2: Measure each stage
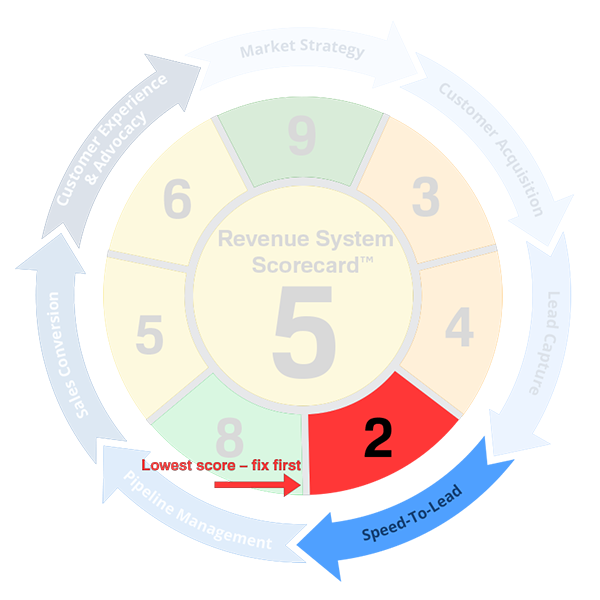
Score each stage on a 1-10 scale. Track key metrics: response time, close rate, churn, etc. That’s the Revenue System Scorecard™.
Step 3: Identify the biggest constraint
Which stage, if improved, would unlock the most growth? That’s your bottleneck.
Step 4: Improve that one thing
Focus resources. Don’t spread them thin.
Without measurement, you’re gambling. With measurement, you’re investing.
What Happens When You Skip Measurement
Scenario A: You guess wrong
- You spend $50k on new ads – but the real leak is slow response.
- You hire a sales trainer – but the pipeline is undefined.
- You improve onboarding – but churn is caused by pricing, not process.
Each move adds cost, not growth.
Scenario B: You measure first
- Self-Assessment shows Speed-to-Lead score = 3/10.
- You focus on response time. Cost: $5k for alerts and routing.
- Result: Contact rate doubles. Revenue impact: $200k/year.
Difference: $45k saved in wasted spend + $200k new revenue.
The Metrics That Matter
You don’t need a hundred KPIs. You need a handful, per stage.
Stage | Key Metric |
Market Strategy | Lead quality score (subjective, but tracked) |
Customer Acquisition | Cost per qualified lead, source mix |
Lead Capture | Form conversion rate, missed call % |
Speed-to-Lead | Average response time, % contacted within 5 min |
Pipeline Management | % of deals with next step, stale deal %, forecast accuracy |
Sales Conversion | Close rate by rep, average sales cycle length |
Customer Experience & Advocacy | Monthly churn %, NPS, referral rate, review volume |
Pick 1-2 per stage. Measure them weekly or monthly. Review them as a leadership team.
How the Self-Assessment Provides Baseline Measurement
The Revenue System Self-Assessment™ does not require you to input these metrics. Instead, it asks a set of structured questions that translate into a score for each stage.
Example:
- “How quickly does your team respond to new leads on average?”
- “What percentage of inbound calls go to voicemail and are never returned?”
Your answers generate a 1-10 score.
After completing the assessment, you know:
- Which stage is your strongest (8-10)
- Which stage is your weakest (1-4)
- Where to focus first
That’s baseline measurement. It’s free and takes 7 minutes.
From Measurement to Diagnosis
The Self-Assessment tells you where you’re weak. The Revenue Leakage Estimator™ tells you how much those weaknesses are costing you.
But to get why – root cause – you need a structured diagnostic.
That’s the Revenue Pipeline Diagnostic™. It goes beyond measurement to find the specific breakdowns: routing failures, undefined stages, missing SLAs.
You can’t improve what you can’t quantify. Stop guessing.
Take the free Self-Assessment. Score your stages. Find your weakest link. Then decide whether to fix it yourself or book a Diagnostic.
But measure first. Always.