
Most businesses ask: “How much should we spend on growth?”
That’s the wrong question.
The better question is: “Where should we invest next?”
Because $20,000 can go to more ads, or to fixing your follow-up system. One might return 5% – the other might return 50%. The difference isn’t the amount; it’s the allocation.
High-growth organizations don’t spread resources evenly. They allocate capital to the highest-leverage stage, then to the next, then to the next.
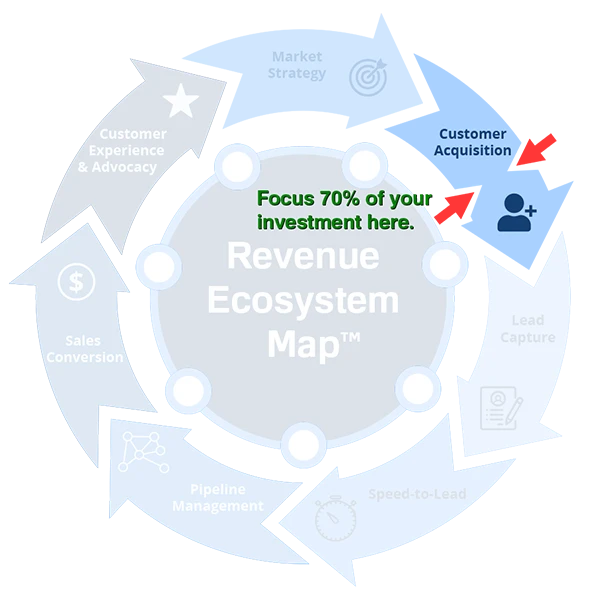
Revenue Ecosystem Map™ Customer Acquisition bottleneck
The Mistake of Equal Distribution
Many companies spend growth capital like this: $20k on additional ads, $15k on sales training, $10k on new software, $5k on a consultant.
They feel busy. But they haven’t asked: Which of these investments will actually move the needle?
Often, the answer is “none of them” – because the real bottleneck is elsewhere.
Example: If slow response is your bottleneck (4-hour average), then more ads, sales training, a new CRM, or a consultant (without diagnosis) will all fail. Result: $50k spent, no growth.
You can spend a fortune on the wrong stage and get nothing. Or spend a fraction on the right stage and get multiples.
The HighROI Allocation Framework
Step 1 – Identify the bottleneck – Use the Revenue System Self-Assessment™ and Estimator to find which stage, if improved, would create the biggest financial impact.
Step 2 – Allocate 70% of your growth budget to that one stage – Don’t spread thin. Focus.
Step 3 – Spend the remaining 30% on maintaining other stages – Don’t let them degrade, but don’t over-invest.
Step 4 – Reevaluate quarterly – The bottleneck shifts. When you break one, a new one appears. Reallocate accordingly.
Comparing ROI Across Stages
Investment | Typical ROI (if bottleneck) | Typical ROI (if not bottleneck) |
Speed-to-Lead fix (alerts, routing, SLA) | 10x-50x | 0.5x-1x (waste) |
Sales conversion improvement | 5x-20x | 1x-2x (if leads aren’t qualified) |
Lead capture optimization | 5x-10x | 1x-2x (if no traffic) |
Retention / churn reduction | 5x-15x | 1x-2x (if acquisition is broken) |
More ad spend | 1x-3x (if downstream is healthy) | 0x-0.5x (if downstream leaks) |
The same investment in different stages yields dramatically different returns. 20konadswhenresponsetimeisbroken→maybe0.5xROI.20konadswhenresponsetimeisbroken→maybe0.5xROI.20k on fixing response time when that’s the bottleneck → 20x ROI.
Real Client Example: Reallocation Win
Client: SaaS business, $8M ARR.
Symptom: High churn (7% monthly). Leadership wanted to spend $100k on a new customer success platform.
Our diagnostic: Churn was high, but the root cause wasn’t missing software – it was that customers didn’t receive any check-in calls after onboarding. No one was assigned to retention.
Reallocation: Instead of $100k on software, spend $60k on a customer success hire and $20k on simple automation for check‑ins. Total $80k.
Result: Churn dropped from 7% to 3.5% in 90 days. Retained revenue: over $1M annually. ROI on the $80k: 12.5x.
If they had spent $100k on software without fixing the process, ROI would have been near zero.
How to Apply This to Your Business
Step 1 – Run the Self-Assessment – Score all 7 stages.
Step 2 – Use the Estimator to quantify leverage – For each low-scoring stage, estimate the financial impact of improvement.
Step 3 – Identify your biggest bottleneck – Combine scores and estimated impact. The stage with low score AND high impact is your constraint.
Step 4 – Allocate 70% of your next growth budget to fixing it – Don’t spread thin.
Step 5 – Measure. Then re-evaluate. – When the bottleneck breaks, find the next one.
When You Need a Diagnostic
If you can’t identify the bottleneck confidently – or if you’ve allocated resources and seen no improvement – book a Revenue Pipeline Diagnostic™.
We’ll find your true constraint and give you a precise allocation roadmap.
Where you invest matters more than how much.
Stop spreading resources thinly. Find your bottleneck. Focus 70% of your growth budget there. Re-evaluate quarterly.
That’s how you turn spending into exponential returns.