
When leaders think about lost revenue, they usually imagine big, dramatic failures:
- A $100k deal lost to a competitor.
- A marketing campaign that flopped.
- A key customer who left without warning.
Those hurt. But they aren’t the main culprit.
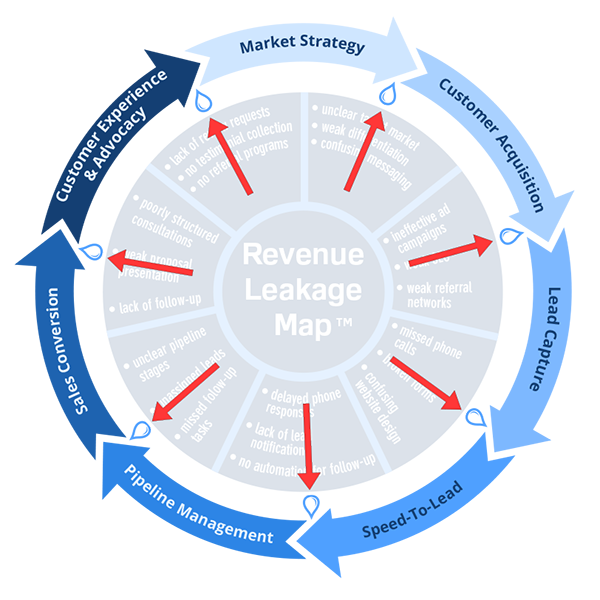
The real drain is quieter. It’s a 5% miss here, a 10% delay there, a 6% conversion drop over there. By themselves, each feels small – not worth a fire drill. But when you add them up across all 7 stages of your revenue system, the cumulative loss can be 30-40% of your potential revenue.
That’s the quiet drain that makes growth feel so hard. You’re working hard, spending money, hiring people – but you’re leaking everywhere.
The Anatomy of a Small Leak
Let’s define what a “small leak” looks like in real business operations.
Leak Type | Example | Annual Impact (for $5M company) |
Missed leads | 5% of inbound calls go to voicemail, never returned | $50k – $100k |
Slow response | 4-hour average response time vs 5 minutes | $100k – $200k |
No-show appointments | 8% of scheduled calls never happen | $40k – $80k |
Weak close rate | 6% below industry benchmark | $150k – $300k |
Excess churn | 7% monthly churn instead of 4% | $150k – $250k |
No referral asks | 10 satisfied clients never asked | $50k – $100k |
Individually: each seems manageable. Together: they can exceed $500k in lost annual revenue – 10% of revenue or more.
A 5% miss isn’t a crisis. But a 5% miss + a 10% delay + a 6% conversion gap + 3% extra churn = a completely different business outcome.
Why Small Leaks Compound
Compounding is not just for interest rates. It works for revenue leakage too.
Example scenario:
- Start with 100 leads.
- Leak #1 (capture): 5% never become leads → 95 remain.
- Leak #2 (response): 10% never contacted in time → 85 remain.
- Leak #3 (qualification): 8% disqualified → 78 remain.
- Leak #4 (conversion): 6% close rate gap → final customers = far fewer than possible.
Step-by-step math:
100 leads × 95% capture = 95
95 × 90% contact = 85.5
85.5 × 92% qualified = 78.7
78.7 × (close rate 20% vs target 26%) = not 20% of 100 (20 customers), but rather:
At 20% close rate: 78.7 × 0.20 = 15.7 customers
At 26% close rate: 78.7 × 0.26 = 20.5 customers
That’s a loss of nearly 5 customers per month from later-stage leaks alone.
Now add retention: if churn is 5% instead of 3%, you lose additional customers over time.
Each leak alone costs a little. Together, they transform your top line.
Formula:
Potential Revenue – (Leak1 + Leak2 + Leak3 …) ≠ Actual Revenue
Because leaks interact multiplicatively, not additively. The order matters, and the cumulative effect is often 2-3x larger than the sum of individual guesses.
Where Small Leaks Hide (Stage by Stage)
Using the Revenue Ecosystem Map™, here’s where to look for small leaks.
1. Market Strategy
- Vague ICP → wrong prospects → wasted sales time.
- Weak differentiation → price pressure → lower margins.
2. Customer Acquisition
- Over-reliance on one channel → volatility.
- No attribution → you don’t know what works.
3. Lead Capture
- Broken forms → abandoned inquiries.
- Missed calls → lost opportunities.
4. Speed-to-Lead
- Response time measured in hours, not minutes.
- No follow-up cadence → leads go cold.
5. Pipeline Management
- Stale deals in CRM → inflated forecast.
- No stage-exit criteria → deals stuck.
6. Sales Conversion
- Inconsistent discovery → wrong solutions proposed.
- No proposal follow-up → deals die silently.
7. Customer Experience & Advocacy
- Weak onboarding → early churn.
- No referral ask → leaving growth on the table.
The Psychological Reason We Ignore Small Leaks
1. They don’t trigger urgency
A 5% drop in conversion this month doesn’t feel like an emergency. A 10% delay in response time doesn’t make headlines. But repeated over 12 months, the effect is enormous.
2. We don’t measure them
If you don’t track missed calls, you assume they don’t happen. If you don’t measure response time, you assume it’s fine. Measurement creates visibility. Without it, leaks stay hidden.
3. We normalize dysfunction
If every company in your industry takes 4 hours to respond, you assume it’s normal. But normal doesn’t mean optimal. The competitor who responds in 5 minutes is winning.
4. We chase silver bullets
Leaders want one big fix – a new channel, a new hire, a new software. Small operational improvements feel unsexy. But they add up.
You don’t need a miracle. You need to stop ignoring the small leaks.
How to Find Your Small Leaks (Practical Steps)
Step 1 – Run a quick self-audit
Ask your team:
- What percentage of inbound calls go to voicemail and are never returned?
- What’s our average response time to a web form?
- How many deals have been in the same pipeline stage for over 30 days?
- What’s our monthly churn rate?
If they can’t answer, that’s a leak itself – a measurement leak.
Step 2 – Use the Revenue Leakage Estimator™
Our free tool calculates the financial impact of missed leads, slow response, weak conversion, and churn. It takes two minutes.
Step 3 – Take the Self-Assessment
The Revenue System Self-Assessment™ scores each stage 1-10. The lower the score, the bigger the likely leak. Prioritize stages with low scores and high estimated impact.
Step 4 – Book a Diagnostic for root cause
If you find multiple small leaks but don’t know why they exist, a Revenue Pipeline Diagnostic™ will map your specific system and deliver a prioritized fix-first roadmap.
Real Client Example: Small Leaks, Big Turnaround
Client: Home services company, $6M revenue.
Leaks identified:
- 12% of inbound calls missed (after-hours, no callback)
- Response time average: 90 minutes
- 15% of pipeline deals stale (>60 days no activity)
- Monthly churn: 6%
Total estimated annual leakage: $720k (12% of revenue)
Fixes implemented:
- Missed call text-back automation
- SMS lead alerts for after-hours
- Weekly pipeline inspection by manager
- Onboarding sequence with 30-day check-in
Results (90 days):
- Missed calls dropped to 3%
- Response time down to 4 minutes
- Stale deals cut by 60%
- Churn down to 3.5%
- Revenue up 18% without increasing ad spend
Cost of fixes: Under $10k. Return: Over $1M annualized.
This is what happens when you stop ignoring small leaks.
Conclusion
Revenue leakage is rarely one big explosion. It’s 5% here, 10% there, 6% somewhere else.
Stop ignoring small leaks. Measure them. Prioritize them. Fix them.
Use the Estimator. Take the Self-Assessment. Book a Diagnostic if needed.
Start plugging the holes. Your revenue will thank you.