
Most companies track response time on an ops dashboard. It sits there quietly – a metric to monitor, maybe a nice to have.
But that framing is dangerously incomplete.
Response time isn’t about “being fast.” It’s about controlling the buying process.
When a lead comes in, intent is at its peak. They’re comparing options, forming criteria, deciding who to trust. The first business to respond shapes that criteria – what matters, what’s compared, how urgency is perceived.
The slower responder enters a different conversation entirely. By the time they reply, the lead has already formed opinions, possibly engaged with a competitor, and set expectations. Now the slower business is reacting, not leading.
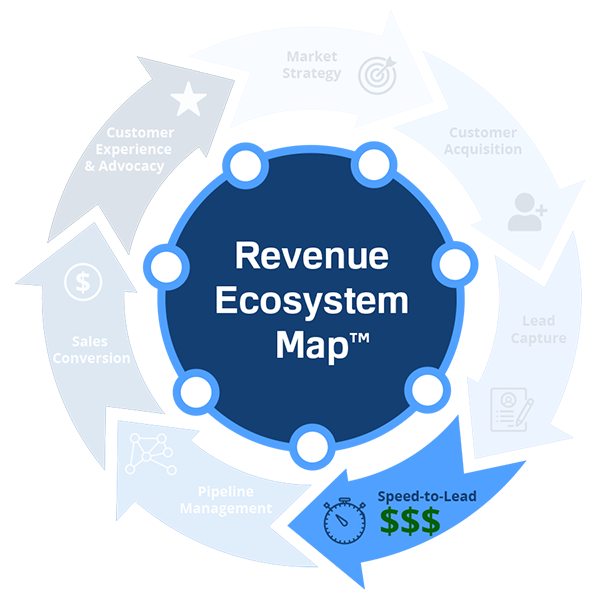
The Data That Should Terrify You
Research consistently shows:
- Responding within 5 minutes dramatically increases contact and conversion rates.
- Every hour of delay reduces the odds of contact by 7%–15%.
- After 24 hours, a lead is 90% less likely to convert than one contacted immediately.
Yet the average company takes 4-6 hours to respond to an inbound lead. Some take 24 hours. Some never respond at all.
A lead responded to in 5 minutes has a 21% contact rate. At 30 minutes, it drops to 15%. At 2 hours, under 10%.
Why Speed Is a Revenue Variable, Not a KPI
Most teams put response time on an ops dashboard. That’s where it lives – quietly, unexamined.
But response time directly drives:
- Contact rates – The faster you respond, the more likely you reach the prospect before they move on.
- Show rates – Early engagement sets expectations and reduces no-shows.
- Competitive positioning – The first responder shapes the buyer’s criteria.
- Conversion probability – Every hour of delay reduces the odds of closing.
Improving response time from 4 hours to 5 minutes is not an operational win – it’s a revenue win.
Example math:
- 200 leads/month
- 20% contact rate at 4 hours → 40 contacts
- 40% contact rate at 5 minutes → 80 contacts
- Assuming 25% close rate on contacted leads, that’s 10 more customers per month.
- At $5,000 average value → $50,000/month increase = $600,000/year.
That’s not efficiency. That’s growth.
Where Slow Response Happens (And Why)
Slow response is rarely laziness. It’s a system failure.
Common causes:
- No lead alerts – Reps don’t know a lead arrived.
- Unclear ownership – Everyone assumes someone else will call.
- After-hours gap – Leads arrive at 8pm, no response until 9am.
- Weak follow–up cadence – One call attempt, then nothing.
- No SLAs – No one is measured on response time.
- Manual routing – Someone has to manually assign leads to reps.
- No missed-call recovery – Voicemails are never returned.
How to Fix It (Practical Steps)
Step 1 – Measure reality
Track average response time, median response time, and percentage of leads contacted within 5 minutes. Most teams are shocked at their actual numbers.
Step 2 – Install instant alerts
Every new lead should trigger an SMS, Slack, or CRM notification to the assigned owner.
Step 3 – Define ownership
Every lead has one person responsible for first contact (and a backup).
Step 4 – Set SLAs
All leads contacted within 5 minutes during business hours. Missed calls returned within 10 minutes.
Step 5 – Automate after-hours
Autoreply emails or texts with a callback promise and scheduling link.
Step 6 – Follow-up cadence
If no response after first attempt, schedule 2-3 more attempts over 24 hours.
Step 7 – Inspect
Managers review response time reports daily. Slow leak flags.
We’ve seen companies cut response time from 2 hours to 5 minutes in one week, with no new hires – just routing, alerts, and SLAs.
Real Client Example
Client: Legal intake firm, 300 leads/month.
Before: Average response time 90 minutes. Contact rate 25%. Close rate 15%.
Fix: Installed SMS lead alerts, defined ownership by geography, implemented after-hours auto-reply with call-back request.
After (30 days): Response time 4 minutes. Contact rate 55%. Close rate unchanged (still 15%), but contact doubled → new clients doubled.
Revenue impact: Additional $40,000/month from same lead volume. Cost of fixes: under $2,000.
How to Calculate Your Speed-to-Lead Opportunity
Use the Revenue Leakage Estimator™ (free, 2 minutes). Select the “Speed-to-Lead” module.
Inputs:
- Monthly leads
- Current contact rate %
- Target contact rate % (realistic improvement)
- Close rate %
- Average client value
The Estimator will show you the monthly and annual revenue gain from faster response.
Or do your own math:
Additional revenue = Leads × (Target contact rate – Current contact rate) × Close rate × Avg value × 12
The Self-Assessment Connection
The Revenue System Self-Assessment™ includes questions about response time, ownership clarity, and after-hours process. If you score low in Speed-to–Lead, the assessment flags it as a critical leak.
When to Book a Diagnostic
If you’ve tried to improve response time and can’t get below 30 minutes, or if you don’t know why leads are falling through the cracks, book a Revenue Pipeline Diagnostic™.
We’ll review your routing logic, alert systems, staffing, and SLAs – then deliver a roadmap for achieving sub-5-minute response.
Slow response is not a minor operational issue. It’s a revenue leak that cedes control of the buying process to faster competitors.
Measure it. Fix it. Then watch your contact rates, conversions, and revenue grow – without spending a dollar more on ads.
Stop treating response time as a KPI. Start treating it as a revenue variable.