
You’ve seen the Self-Assessment. You’ve used the Estimator. You know you have leaks.
But what comes next?
A Revenue Pipeline Diagnostic™ is not a high-level “health check” or a five-minute audit. It’s a structured, rigorous analysis of your entire revenue system – from first click to customer advocacy.
Here’s exactly what it includes, why each component matters, and what you’ll get at the end.
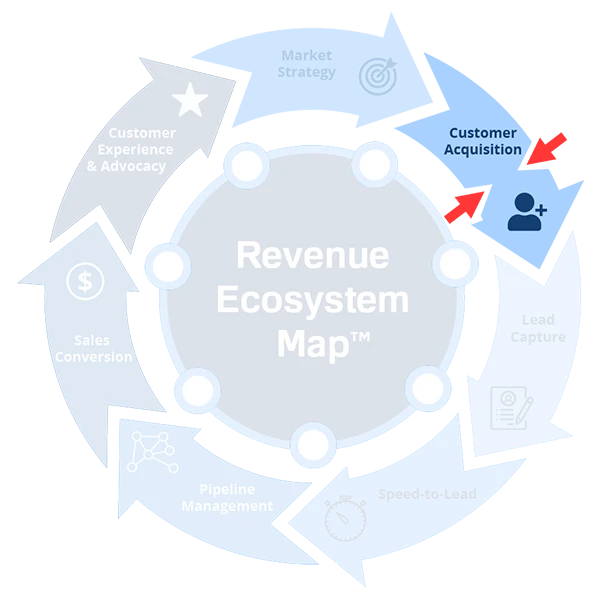
Revenue Ecosystem Map™ Customer Acquisition bottleneck
Output 1 – StagebyStage Evaluation (Revenue System Scorecard™)
What it is: A 1-10 score for each of the 7 stages, based on your actual data, operations, and interviews.
What it includes: Market Strategy clarity, Customer Acquisition efficiency, Lead Capture reliability, Speed-to-Lead performance, Pipeline Management discipline, Sales Conversion consistency, and Customer Experience & Advocacy effectiveness.
Why it matters: Most leaders have a gut feeling about their system. The Scorecard replaces feeling with measurement. You’ll know exactly which stage is strongest and which is leaking the most.
Example output: Market Strategy: 7/10, Speed-to-Lead: 3/10 (critical leak), Sales Conversion: 4/10, other stages: 56/10.
The Scorecard doesn’t tell you everything, but it tells you where to look first.
Output 2 – Revenue Leakage Map™
What it is: A visual diagram showing exactly where value is being lost across the customer journey.
What it includes: Specific leakage points, quantified drop-off percentages, and stage-to-stage conversion rates.
Why it matters: Seeing your leaks mapped out is often a wakeup call. The Leakage Map makes the invisible visible. You can’t fix what you can’t see.
Example output: Lead Capture → Speed-to-Lead: 40% drop (after-hours voicemail no callback). Pipeline Management → Sales Conversion: 25% drop (no proposal follow-up).
Output 3 – Revenue System Architecture Diagram™
What it is: A blueprint of how your tools, workflows, and people connect (or disconnect).
What it includes: Lead flow from form/call to CRM to rep, automation rules, handoff points between teams, and manual vs automated steps.
Why it matters: Many revenue problems are architecture problems – leads stuck because routing is manual, follow-up missing because tasks aren’t automated.
Example output: Lead routing: Manual email from coordinator to rep → 24 hour delay. Recommendation: automate roundrobin assignment.
Output 4 – Revenue Leakage Index™
What it is: A headline metric that estimates the total financial impact of your system’s inefficiencies.
What it includes: Estimated monthly and annual revenue leakage, broken down by stage.
Why it matters: The Index translates operational problems into executive language: dollars.
Example output: Total estimated annual leakage: $620,000 (Speed-to-Lead: $210,000, Sales Conversion: $180,000, Retention: $150,000, Other: $80,000).
Output 5 – Prioritized Roadmap
What it is: A sequenced action plan telling you what to fix first, next, and later, based on economic impact and dependencies.
What it includes: Immediate wins (12 weeks, low effort, high impact), core fixes (13 months), and strategic builds (36 months).
Why it matters: Without a roadmap, you’re left staring at a list of problems and no idea where to start.
Example output: Week 1 – automate lead routing and alerts (cost $2k, gain $150k). Week 23 – implement proposal followup (cost $1k, gain $100k). Month 2 – redefine pipeline stages and train reps (cost $5k, gain $200k). Month 3 – launch referral program (cost $3k, gain $80k).
A diagnostic that ends with a report is incomplete. A diagnostic that ends with a roadmap is valuable.
What Else Is Included (Depending on Scope)
- Executive presentation – A live or recorded walkthrough of findings.
- CRM data export analysis – We look at your actual CRM records to validate assumptions.
- Stakeholder interviews – We speak with your sales reps, ops staff, and managers.
- Implementation support (optional) – We can help you execute the roadmap (Remediation™).
How Long Does a Diagnostic Take?
Scope | Duration | Fee Range |
Light (single department, e.g., sales) | 23 weeks | $2,500 – $5,000 |
Standard (full 7stage system) | 46 weeks | $5,000 – $12,000 |
Enterprise (multi-location, complex) | 68 weeks | $12,000 – $25,000 |
What You Get (The Deliverable)
- PDF report (30-40 pages) with findings, maps, scorecard, index, and roadmap.
- Optional executive presentation (Zoom or in-person).
- Optional follow-up Q&A session.
No fluff. No generic advice. Tailored to your business.
How It’s Different from a Free Audit
Aspect | Free “Health Check” | Revenue Pipeline Diagnostic™ |
Depth | 10-15 minutes, high-level | 46 weeks, deep analysis |
Data | Self-reported, no verification | Your actual CRM, calls, interviews |
Output | Generic tips | Tailored roadmap with cost/benefit |
Actionability | Low | High (prioritized, sequenced) |
Cost | Free | Paid (but ROI typically 10x-50x) |
Free audits give you generic advice. A Diagnostic gives you a custom roadmap.
How to Book a Diagnostic
Step 1 – Take the free SelfAssessment (to confirm you’re a fit)
Step 2 – Use the Estimator to see potential ROI
Step 3 – Book a discovery call to discuss scope and timing
A Revenue Pipeline Diagnostic™ is not a five-minute audit. It delivers a stage-by-stage Scorecard, Revenue Leakage Map™, System Architecture Diagram, Leakage Index, and Prioritized Roadmap.
Stop guessing. Get a map.